


PermalinkStory time
Since a while, I've been stumbling upon cases with underlying memory leaks, analysing and fixing them. Most of the time the story starts with some alarm informing about increased memory usage for one of the services. After taking a closer look the chart shows that there is a slow and steady increase in memory usage since deployment. Redeploying the service yields a similar trend over time - the memory slowly and steadily increases. Such a behaviour means that the app is allocating more and more memory and at the same time it fails to free it, which can be described as memory leak.
PermalinkHow does Node.js manage memory?
Node.js (or rather underlying v8 engine) allocates memory dynamically. When the new objects are created the memory is allocated respectively, the program uses it and releases it as soon as the objects become unused. To free the unused data v8 uses Garbage Collector that runs periodically, detects objects that are no longer referenced and frees memory assigned to them.
PermalinkSo why do memory leaks occur?
Memory leak occurs when the app allocates more memory, but fails to to release it when it is no longer used. It can have serious consequences on the app by impacting its performance or leading to occupying all memory available for the process and leading to crash.
But you may ask why Garbage Collector does not handle that? As mentioned before Garbage Collector detects unreferenced data and frees it. However, there may be some constructs that lead to accumulating the data and keeping some references that prevents Garbage Collector from doing its job. The data may no longer be needed, but it is still referenced, hence kept by the app.
PermalinkWhat can cause memory leaks?
Most common sources of memory leak includes:
global variables that accumulate some data
caching data without proper cleanup
keeping unused event listeners
closures that reference the data from its scope, preventing from disposing it
external libraries with some faults related with memory management
Later in the article we'll dive into examples that cause memory leaks.
PermalinkHow can we detect memory leaks?
Regardless of the way how your app is deployed (whether utilising VMs or containers), I'm assuming that there is some monitoring in place. Most likely there is some alarm related with memory usage created as well, which may get triggered as the memory consumption raises. In my case, I've been using AWS CloudWatch metrics to notice rising memory usage trends over time, which after some time caused one of the alarms to be triggered as memory usage reached an overly high level.
If you don't have proper monitoring for memory usage I'd advise to invest in some along with alarms as the suspicious level is reached.
Once you're aware of questionable memory usage patterns you can invest in some mechanism to gather heap snapshots for further investigations. Good idea would be to gather 2 or 3 snapshots over time as the memory usage rises when the app is running. Later in the article I'll expand on how to make heap snapshots.
As heap snapshots are gathered, you can compare them and analyze how the memory has been allocated by new data and which area may be affected by the memory leak. Snapshots provide you with stack traces to your code. If some area is suspicious you can try to run the app locally, trigger the processing related to the area, gather snapshots to confirm the cause. After the memory issue is fixed, you can once again test the app locally and confirm whether the leak has been fixed.
Sometimes detecting the root cause can be tricky as the memory raises over time and it's hard to reproduce the issue locally. To solve that problem you can gather heap snapshots from the production environment to understand which user interaction contributed to undesired behavior and track down what's the root cause.
PermalinkHow to make heap snapshots?
There are various options to make a heap snapshot - all of them are described in Nodej.js docs. In my case, I've been using 2 of them - the one with the inspector for local testing and the other one with writeHeapSnapshot when I wanted to get snapshots from the production environment.
I've made a simple API using Fastify to illustrate how to make a heap snapshot. It emulates a simple blogging platform (similar to Hashnode) which allows users to create posts for various people. The app uses MongoDB with Mongoose to create blog posts in separate databases named by tenants. There are 2 endpoints exposed for creating entries - one of them uses incorrect Mongoose config, which leads to data leak we'll investigate soon.
The app can be started using node app.js which is a start script. For generating some traffic I've prepared 2 scripts: test:posts and test:leaking-posts that use AutoCannon to generate requests for endpoints respectively.
PermalinkGetting the heap snapshot using inspector
We can use node --inspect app.js (added to example as start:inspect script) to expose a debugger that we'll later connect to using inspector. Later we can open chrome://inspect in Chrome to open the inspector and click inspect to connect to the running Node.js process. We should get a Debugger attached. message in the terminal in which we're running, which means that we successfully connected.
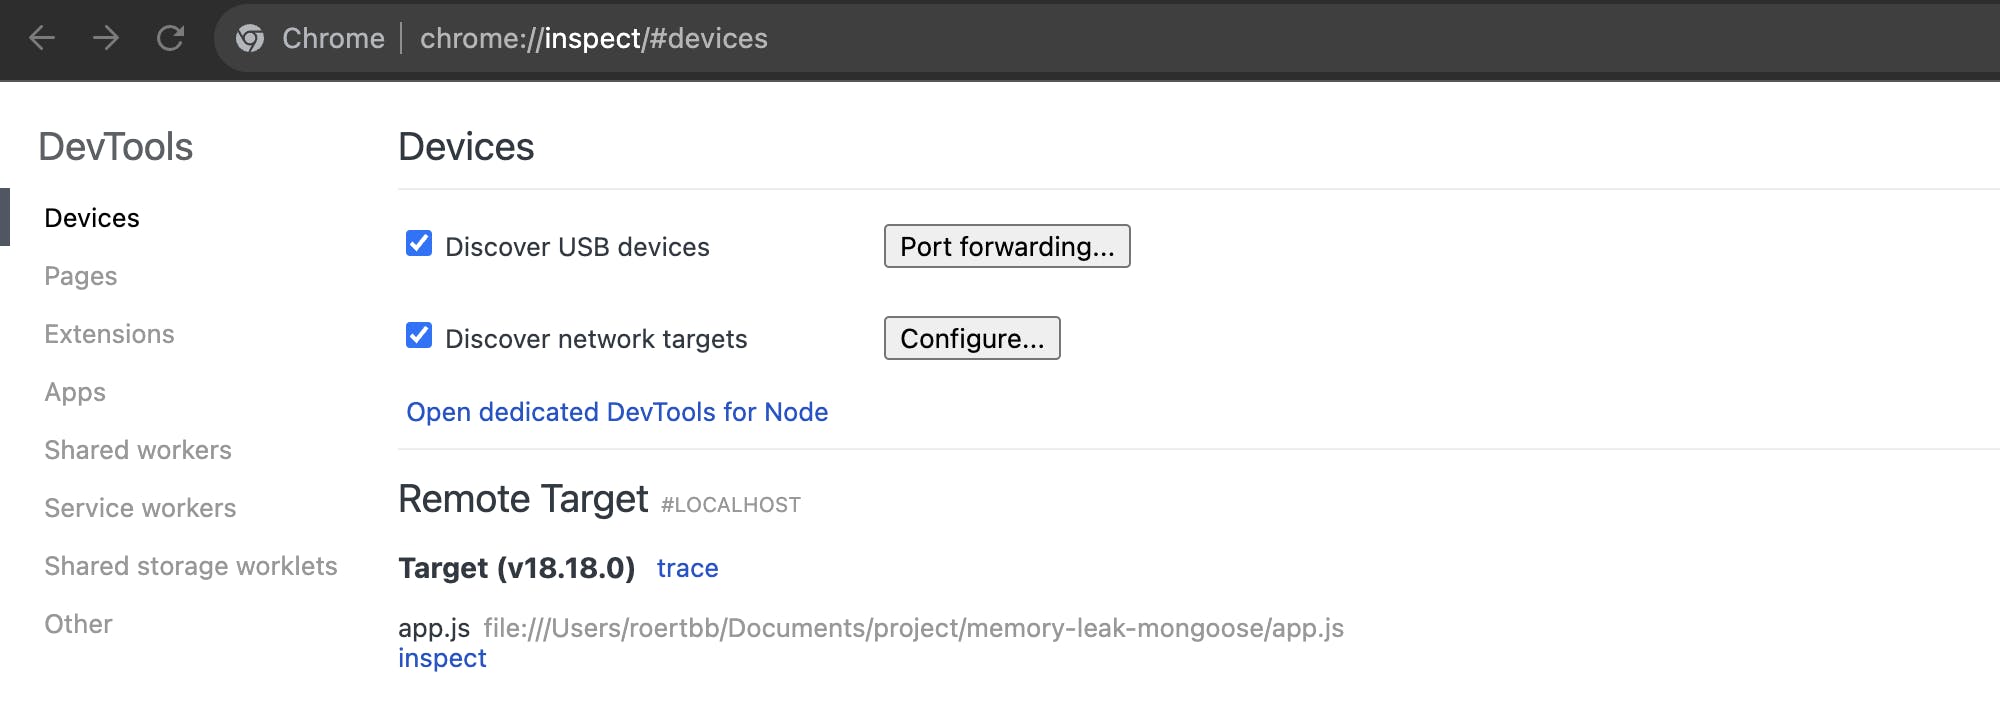
The DevTools window should pop up and we should be able to click Take snapshot to get the data we want.

Next we can make some traffic by running the AutoCannon via test:leaking-posts script to create some posts over next 10 seconds and surface the memory leak and make another snapshot. We can save snapshots for later or analyze them immediately.
PermalinkGetting the heap snapshot using writeHeapSnapshot
Similarly to the previous case, we can take a snapshot from the app and store it for further analysis. That solution can be beneficial when connecting to the app using an inspector is more difficult as for example an app is hosted in the cloud using containers. We can create a dedicated endpoint that will make a snapshot and upload it somewhere for our further analysis.
However, you should be careful with this solution! Make sure that the endpoint is properly secured with proper authorization to prevent others from using it. Secondly, as mentioned in Node.js docs, when the snapshot is created the other work in the main thread is stopped, making the app not accessible for a moment. What's more, the snapshot is created in memory, doubling the heap size, which can lead the app to running out of memory and crashing it. Be aware of using it in production, because it can affect the app availability.
In the example app I've provided there is /heap-snapshot endpoint that looks as follows.
fastify.post("/heap-snapshot", async function handler(request, reply) {
  const tmpDir = os.tmpdir();
  const filePath = path.join(
    tmpDir,
    heap-snapshot-${new Date().toISOString()}.heapsnapshot
  );

  const snapshotPath = v8.writeHeapSnapshot(filePath);
  if (!snapshotPath) {
    throw new Error("Failed to write heap snapshot");
  }

  return { filePath };
});
It generates a file path in a temporary directory, uses it to write a heap snapshot there and returns the path from the endpoint. Alternatively, we can upload the snapshot somewhere if the file system is not accessible for us. Similarly, to the case with the inspector, we can create 2 snapshots - as the app started and later after we create some posts.
PermalinkAnalysing heap snapshots
Having the snapshots ready, we can move on and analyze it to detect the source of memory leak. We can load snapshots using Chrome DevTools by opening them, moving to the Memory tab and loading the files we've saved before.
Next, we can click the snapshots to inspect it. We can change the view to Summary or Statistics to investigate how the memory is allocated, however the most useful option will be Comparison in which we can compare one of the snapshots to another. What's more we can sort the entries by Size Delta and expand the rows to analyze how the memory has been allocated between the created snapshots.

PermalinkAnalysing root cause of memory leak from example app
If we expand the first 2 entries on the list, we'll notice a stack trace pointing to posts and further to Mongoose connections.

If we try to google around we'll find other people who mentions similar problems, moreover the official Mongoose docs describes the proper setup for shared multi tenant connection.
Under the hood Mongoose manages the connections and handles the models caching internally, which works well for a single database. However, with multi tenant setup it requires enabling connection caching and reusing models properly, as mentioned in the docs. Without it, we can end up with memory leaks if we create new connections and re-create models every time.
The solution for that problem can be found in blog-repository.js which includes proper setup for Mongoose. You can try it out, gather and analyze the heap snapshots before and after running the endpoint and compare them with the previous ones.
PermalinkAnalyzing causes of memory leaks
The problem with the example app is a minimalistic reproduction of a production issue I've encountered some time ago.
The other case of memory leak I've encountered was related to some in-memory cache that was not cleared up properly. The app required retrieving sessions for some callback processing, so to optimise the process there was an in-memory cache with local copy of the data, with the fallback to Redis session store. For most of the cases the mechanism worked properly - the data was retrieved initially and stored in in-memory cache, it was used later and disposed of as the processing completed. However, for some cases resulting with an error or due to lack of proper termination, the clean up never happened and the session remained in cache until the next deployment.
The heap snapshot pointed out the path to local cache which was the root cause. Cache entries contained the session IDs which pointed to operations that were further analyzed. The state of processing and logs helped with analysing the situation and discovering the underlying issues.
To address the problem I've tried initially to fix the issues with errors and lack of termination, however it required further modification to the app flow that would be more time-consuming. As a quicker solution, I've adjusted the in-memory cache with node-cache to have some TTL (Time To Live) after which the uncleared sessions were cleared.
Some other interesting case described by Kent C. Dodds and analyzed further with Matteo Collina covers the memory leak in an external library for syntax highlighting that was not disposing the allocated memory. The interesting solution from that debugging session was to run the highlighting in the worker thread and once the work is done, the thread can be disposed of along with the leaked memory.
PermalinkSummary
That's all for today! The issues with memory leak are not that common, however when some issues like that come in a way, with some app which is already running for quite some time, it may be difficult to diagnose them efficiently. I hope I was able to show you how to hunt memory leaks in Node.js, how to gather heap snapshots and analyze them further as well as give you some insight on example cases that can cause issues in other apps. It took me some time to get more familiar with the tools and how to dive into the snapshot output so don't be discouraged to tinker with the outputs or experiment with the app until you become familiar with it.
That's all from my side. I'm wondering about your experience with memory leaks? Did you encounter some similar problems? How did you solve them? What was the root cause? I'll be more than happy to hear your opinion!